Benchmarking Websites with ab and tsung
Everyone enjoys responsive websites and being that I host a few, look for ways to improve their speed. Previously, I was interested in, HTTP, HTTPS, and HTTP/WAF, I now primarily focus on HTTPS. Browsers and third-party online services may be used in order to benchmark page performance but began to look at other solutions. Two online services are Pingdom Website Speed Test and PageSpeed Insights.
The first tool I leveraged was Apache Bench, commonly known as ab. This allows me to run a quick test in order to determine the max requests per second (req/s). While fun, it is not a practical metric as there a a number of factors that must be considered when benchmarking a web-service and understanding where weaknesses may present themselves.
HTTPS requests with keep-alives, connection reuse provides significant speedup:
$ ab -k -n 60000 -c 100 -f TLS1.2 -H "Accept-Encoding: gzip,deflate" https://www.rsreese.com/web-stack/
This is ApacheBench, Version 2.3 <$Revision: 1757674 $>
Copyright 1996 Adam Twiss, Zeus Technology Ltd, http://www.zeustech.net/
Licensed to The Apache Software Foundation, http://www.apache.org/ Server Software: nginx
Server Hostname: www.rsreese.com
Server Port: 443
SSL/TLS Protocol: TLSv1.2,ECDHE-RSA-AES256-GCM-SHA384,2048,256
TLS Server Name: www.rsreese.com Document Path: /web-stack/
Document Length: 2575 bytes Concurrency Level: 100
Time taken for tests: 7.124 seconds
Complete requests: 60000
Failed requests: 0
Keep-Alive requests: 59447
Total transferred: 220557235 bytes
HTML transferred: 154500000 bytes
Requests per second: 8422.57 [#/sec] (mean)
Time per request: 11.873 [ms] (mean)
Time per request: 0.119 [ms] (mean, across all concurrent requests)
Transfer rate: 30235.32 [Kbytes/sec] received Connection Times (ms) min mean[+/-sd] median max
Connect: 0 1 8.0 0 172
Processing: 0 11 5.5 11 55
Waiting: 0 11 5.4 10 45
Total: 0 12 10.5 11 203 Percentage of the requests served within a certain time (ms) 50% 11 66% 13 75% 15 80% 16 90% 18 95% 21 98% 26 99% 28 100% 203 (longest request)
While Apache Bench provides a quick analysis of some of our page speed, tsung is benchmark tool that can provide additional performance insights through its advanced configuration options. The configuration states that we are running tsung locally, the target host, the interval for this phase (yes, you can have more), user agent in which we have two with a ratio defined, and finally the session, which in this case will cause tsung to send as many requests as it can. Again, this is not realistic, just fun.
<?xml version="1.0"?><tsung loglevel="notice" version="1.0"> <clients> <client host="localhost" use_controller_vm="true" maxusers="10000"/> </clients> <servers>
<server host="www.rsreese.com" port="443" type="ssl"/>
</servers> <load> <arrivalphase phase="1" duration="1" unit="minute"> <users maxnumber="10000" interarrival="0.05" unit="second"/> </arrivalphase>
</load> <options> <option type="ts_http" name="user_agent"> <user_agent probability="80">Mozilla/5.0 (Windows NT 6.1; rv:34.0) Gecko/20100101 Firefox/34.0</user_agent> <user_agent probability="20">Mozilla/5.0 (Macintosh; Intel Mac OS X 10_10_1) AppleWebKit/537.36 (KHTML, like Gecko) Chrome/39.0.2171.95 Safari/537.36</user_agent> </option> </options> <sessions>
<session name="web-stack" probability="100" type="ts_http"> <for from="1" to="10000" var="i"> <request><http url="/web-stack/" version="1.1" method="GET"/></request> </for> </session> </sessions>
</tsung>
Run tsung and generate the reports. Optionaly, multiple reports can be combined. You may have to sudo depending your systems permissions.
$ tsung -f origin.xml start
$ cd results-directory
$ /usr/lib/tsung/bin/tsung_stats.pl
$ tsplot "HTTP" 20150418-1658/tsung.log "HTTPS" 20150418-1712/tsung.log -d combine2/
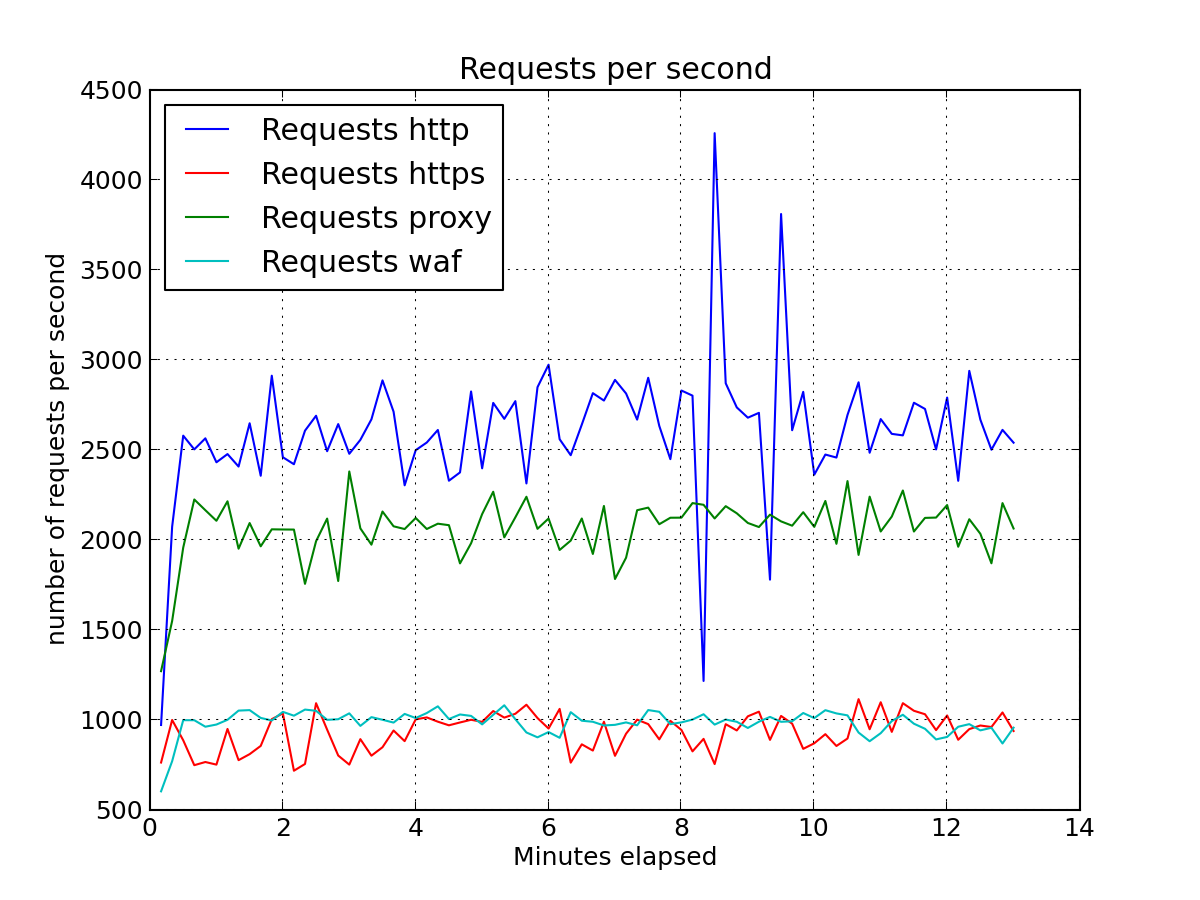
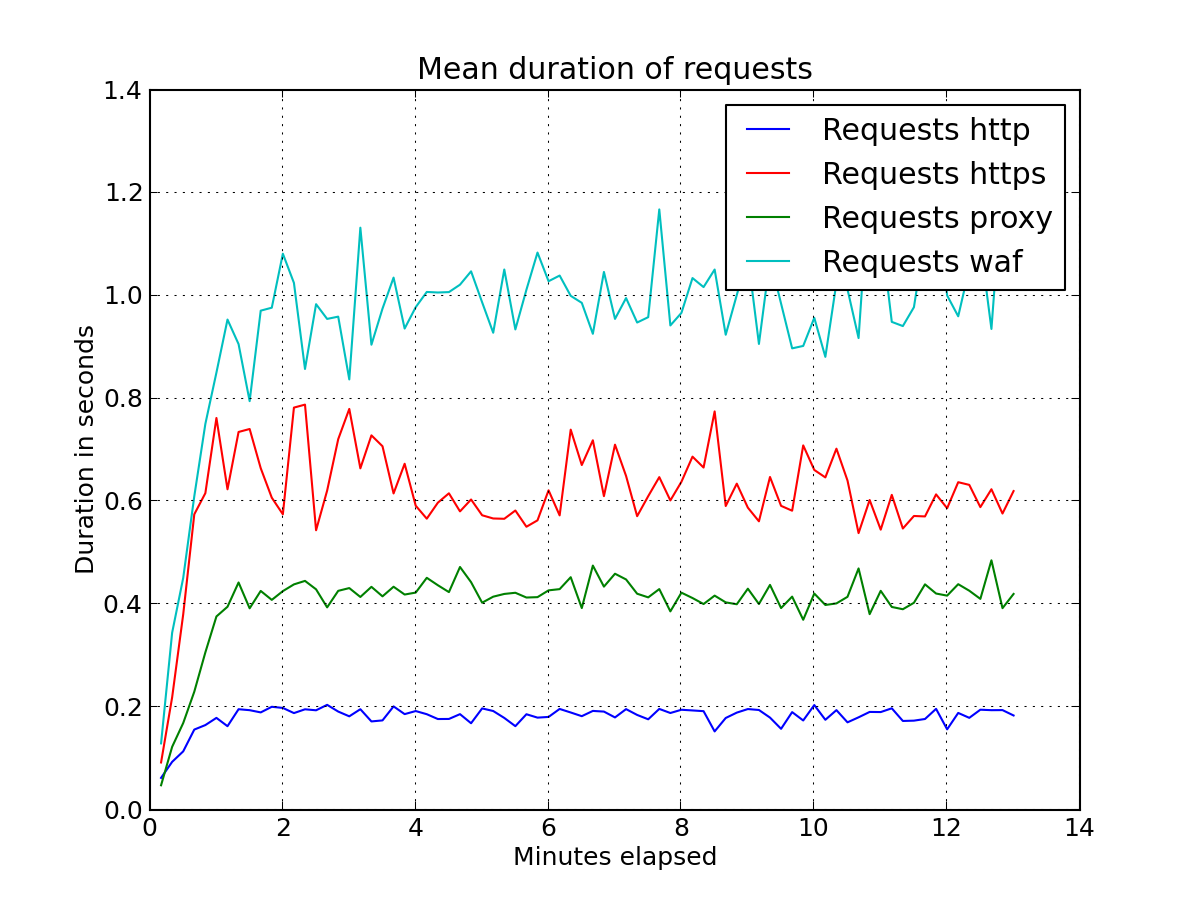
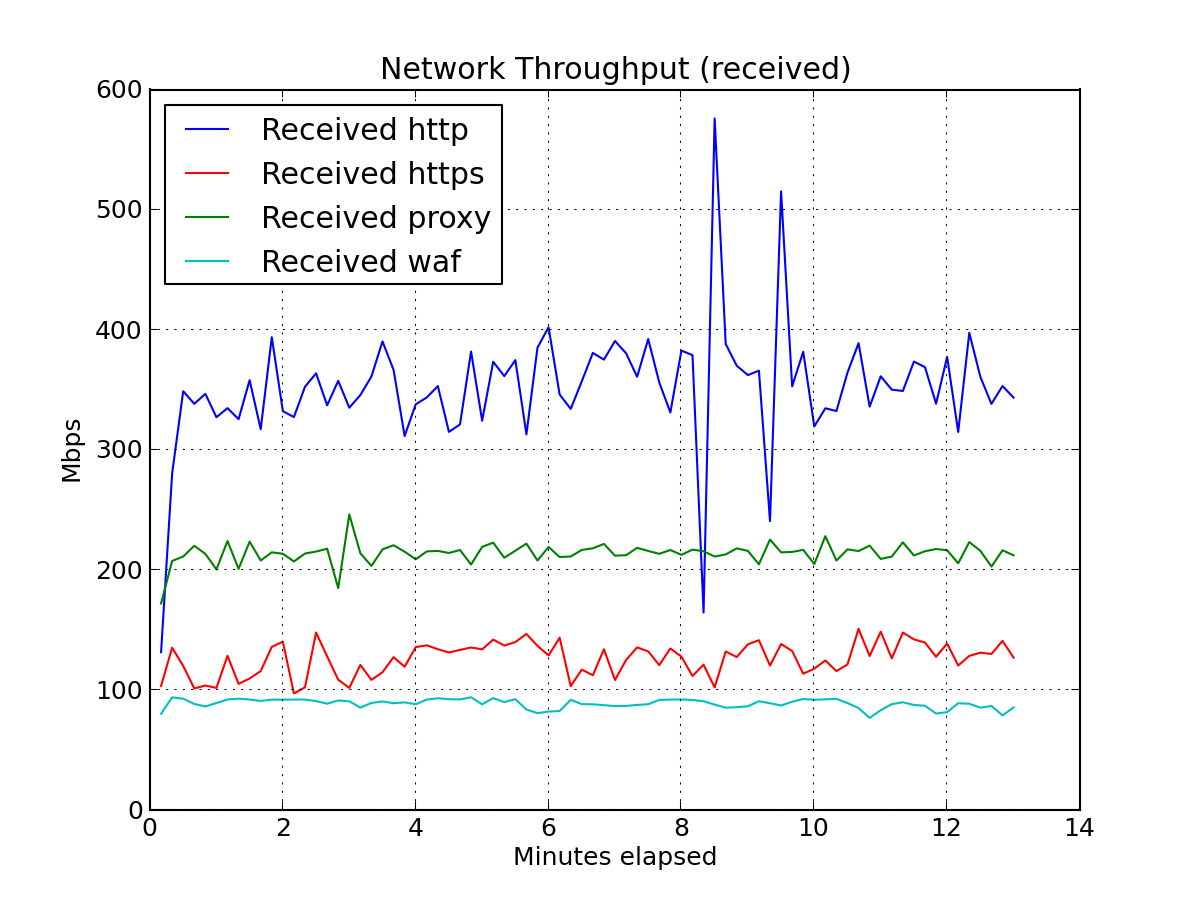
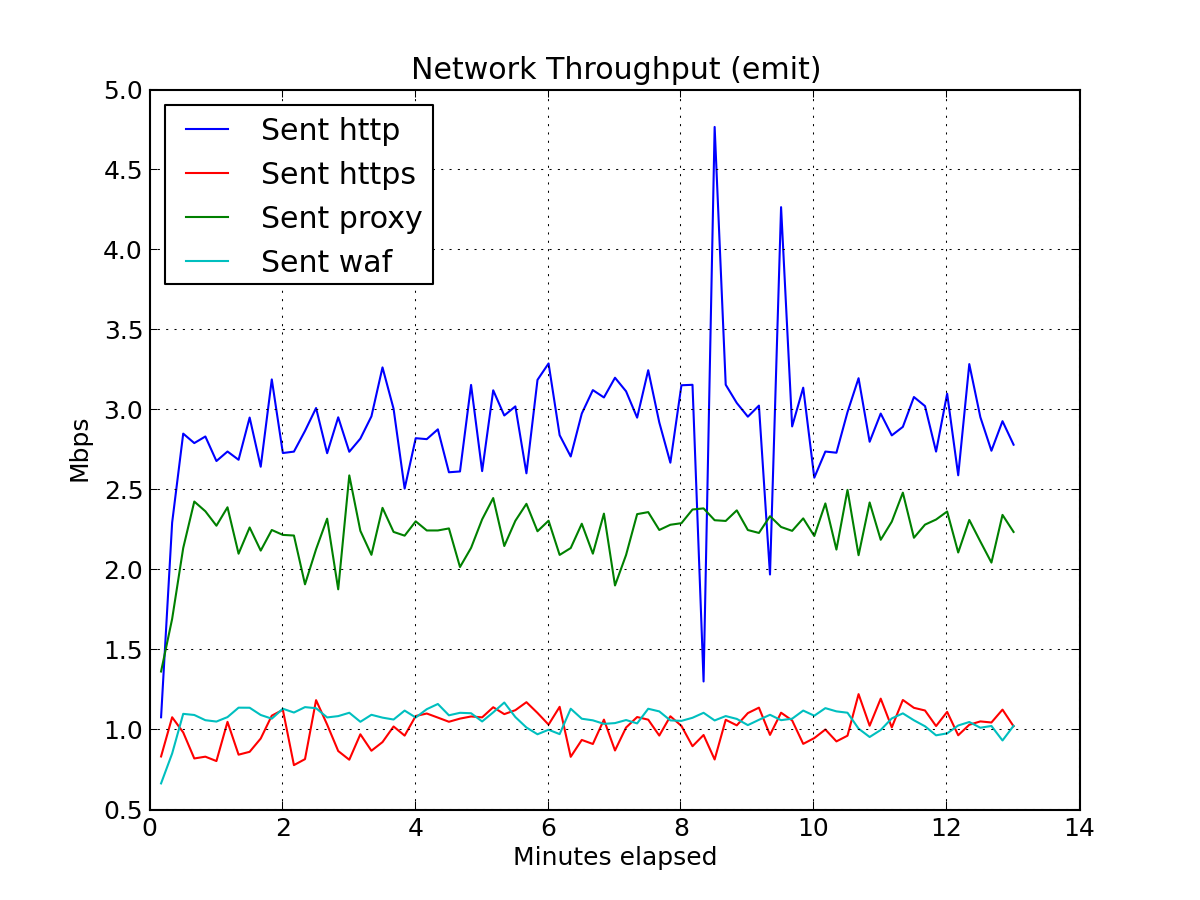
tsung provides useful reports and graphics. For the sake of brivety, I will not include the report but just a few charts.
With this baseline, you can tailor the tsung configuration to include phases of increasing user load along with multiple pages and actions. See the tsungdocumention for details and leave a comment below if you have any questions about this post.