This is an overview of installing and running Moloch on a single host. After seeing the 2013 ShmooCon presentation, I have been looking forward to giving the tool a test-drive. Per the documentation, “Moloch is a open source large scale IPv4 full PCAP capturing, indexing and database system”. It is fast and has a pretty nice interface to boot. Although it does not contain the same feature-set as some commercial over the shelf (COTS) products, I see Moloch fitting into a similar space where COTS products such might sit. When analysts are made aware of anomaly-based alerts from signature/misuse based intrusion detection systems (IDS), e.g. Snort, or anomalous activity from network flow, e.g. SiLK, the analyst can obtain packet capture (PCAP) for further investigation. The existing commercial tool suites are expensive PCAP indexing tools if that is all they are being used for, especially if you are locked into their storage mechanism. A budget conscious security operation center (SOC) can setup Moloch for a fraction of the maintenance cost of commercial offerings and instead use the funds for additional hardware (longer retention), maintenance, and even some Moloch development contribution.
Although the developers have provided a script to get Moloch going, I had a few hiccups so I figured I would document them in the event they help someone else out. I used a CentOS release 6.4 (Final) x86_64 base bare-metal install. I imagine you could run it in a virtual environment for testing purposes. After you get the operating system (OS) installed and patched, pull down the latest Oracle Java for your distribution. Untar the package and create a symbolic in a directory that Moloch will be able to find.
$ sudo cp -R jre1.7.0_17/ /usr/bin/
$ sudo  ln -s /usr/bin/jre1.7.0_17/bin/java /usr/bin/java
Next, pull down the latest moloch build. I just grabbed the ZIP but it is hosted on GitHub. You might want to take a look at the install script to see if everything is ideal for you. Run the easy installer which should pull down the prerequisites needed, build and install.
$ cd moloch-master/
$ sudo ./easybutton-singlehost.sh
If everything went smoothly, the script will try starting the three Moloch components being elasticsearch, capture, and viewer. The latter process did not start and this was probably for the better as I required me to take a closer look at what the install script was doing and the default configuration files (config.ini and elaseticsearch.yml). The configuration files are located in:
# ls -l /data/moloch/etc/
total 4680
-rw-r--r--. 1 root root    6766 Mar 14 17:21 config.ini
-rw-r--r--. 1 root root    6551 Mar 13 22:30 config.ini.template
-rw-r--r--. 1 root root   12545 Mar 14 22:54 elasticsearch.yml
-rw-r--r--. 1 root root 3360134 Mar  6 15:10 GeoIPASNum.dat
-rw-r--r--. 1 root root 1358092 Mar  5 21:48 GeoIP.dat
-rw-r--r--. 1 root root    1249 Mar 13 22:31 moloch.crt
-rw-r--r--. 1 root root    1029 Mar 13 22:31 moloch.csr
-rw-r--r--. 1 root root    1704 Mar 13 22:31 moloch.key
-rw-r--r--. 1 root root   10875 Mar 13 22:31 openssl.cnf
-rw-r--r--. 1 root root   10909 Mar 13 22:30 openssl.cnf.template
First, I had to sort out what was preventing the viewer from starting so I took a look at the viewer.log.
Mar 13 23:13:04 http.c:245 moloch_http_connect(): Connecting 0x7f6e0d19b010
Mar 13 23:13:04 http.c:276 moloch_http_connect(): 0x7f6e0d19b010: Error: Error connecting: Address family not supported by protocol
Couldn't connect to elastic search at 'localhost:9200'
Log files are located in:
# ls -l /data/moloch/logs/
total 6047776
-rw-r--r--. 1 root root 6180585472 Mar 15 23:44 capture.log
-rw-r--r--. 1 root root   12062720 Mar 14 17:22 capture.log.old
-rw-r--r--. 1 root root          0 Mar 13 22:31 Moloch_index_indexing_slowlog.log
-rw-r--r--. 1 root root          0 Mar 13 22:31 Moloch_index_search_slowlog.log
-rw-r--r--. 1 root root        163 Mar 15 20:00 Moloch.log
-rw-r--r--. 1 root root       2943 Mar 13 23:27 Moloch.log.2013-03-13
-rw-r--r--. 1 root root      35410 Mar 14 23:34 Moloch.log.2013-03-14
-rw-r--r--. 1 root root     208487 Mar 15 23:06 viewer.log
-rw-r--r--. 1 root root       1668 Mar 15 09:06 viewer.log.old
I had to change the directive in the config.ini from localhost to 127.0.0.1, otherwise the viewer would not connect to the elasticsearch instance in CentOS. Probably due to the initial IPv6 look-up, just a guess. Also added a Berkley packet filter (BPF) to prevent the capture and indexing of internal-to-internal traffic.
elasticsearch=127.0.0.1:9200
bpf=not src net (10.0.0.0/8) and dst net (10.0.0.0/8)
While I was adjusting the configuration, I decided to adjust the elasticsearch memory usage from what I originally specified in the installer script. You might want to take a look at their hardware requirements but I was able to run with a less powerful node:
$ sudo vim /data/moloch/bin/run_es.sh
ES_HEAP_SIZE=2G bin/elasticsearch -Des.config=${TDIR}/etc/elasticsearch.yml
The viewer would now start (the capture and viewer process were already running but had gracefully killed them). Here are the commands to start each process based on the default installation criteria.
$ sudo nohup /data/moloch/bin/run_es.sh
$ sudo nohup /data/moloch/bin/run_capture.sh &
$ sudo nohup /data/moloch/bin/run_viewer.sh &
Sessions page screen-shot after capturing some traffic, not including session listing:

Stats page screen-shot:
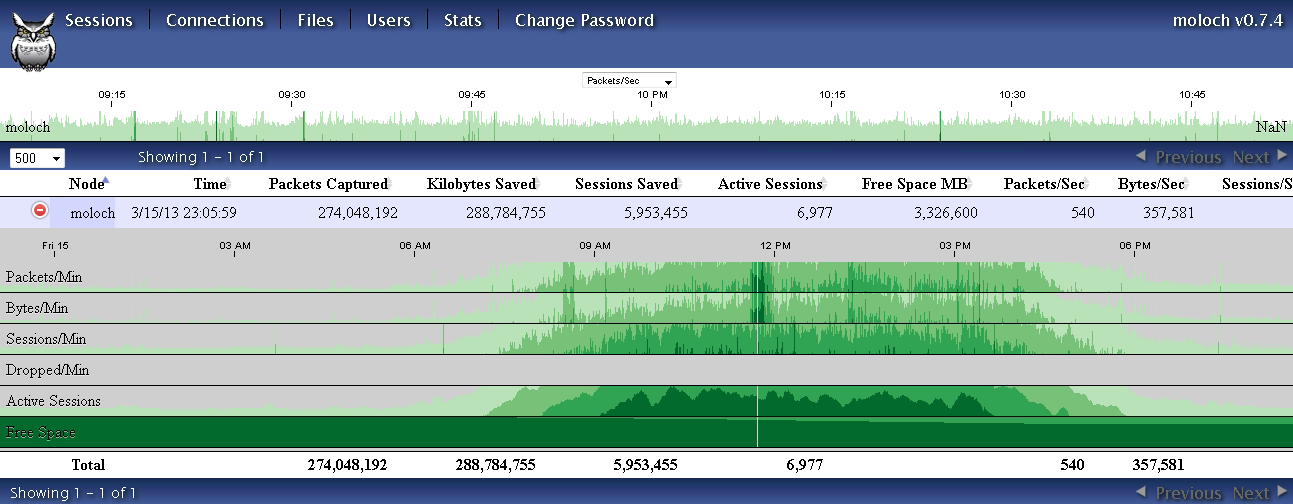
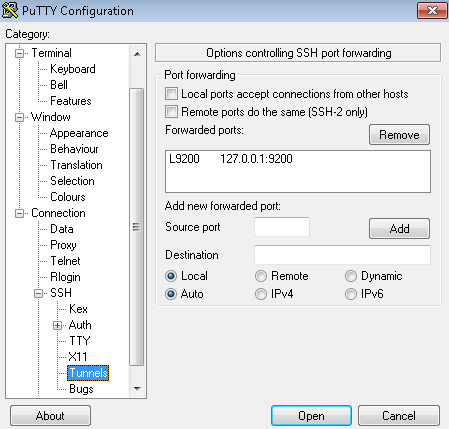
I noticed the mention of two plugins to keep tabs on the elasticsearch memory usage and to maintain session data. This is pretty important as I determined if you remove PCAP and the session data remained, think metadata, users that attempted to drill-down on the aforementioned session data for the missing PCAP would cause the viewer process to die. In my case, I setup Putty to tunnel my connection to the locally listening plug-in interfaces and delete the offending session data:
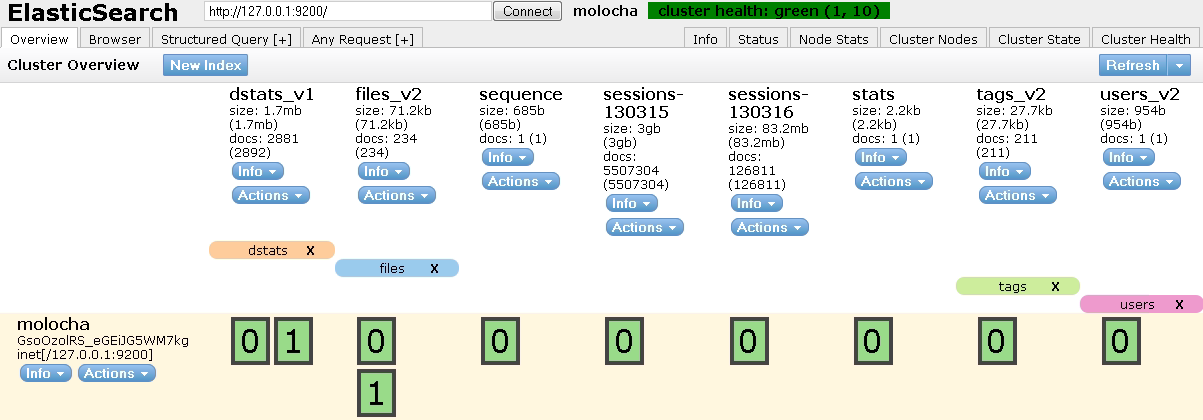
ElasticSearch maintenance screenshot located at http://127.0.0.1:9200/_plugin/head/ after tunneling via Putty. I was able to drop the session via this interface.
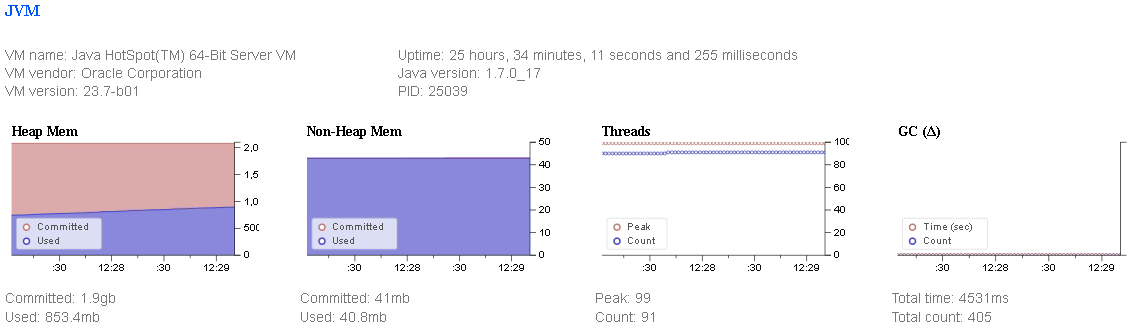
Node statistics screen-shot accessed at http://127.0.0.1:9200/_plugin/bigdesk/ after correctly configuring Putty. Note that we want to keep an eye on the heap memory to ensure it does not approach the maximum specified value. There are many more statistics not shown in this screen-shot.
Here is a Youtube video featuring Moloch in actions. As usual, if you have trouble installing or running Moloch, please leave a comment below, and do not forget to check out the Moloch FAQ.
Comments
comments powered by Disqus