This blog entry shows how to easily insert flow data into an ElasticSearch instance using Logstash and view the data using Kibana. To keep the example simple, we will use Kibana that is integrated in LogStash. We will not use the ElasticSearch that is bundled with LogStash. Instead, we will run latest stable version of ElasticSearch. Testing for this entry was done using Ubuntu 12.04 but most Linux or similar distributions should work fine.
First, I needed the ability to generate network flow. Softflowd provided a simple solution for my purposes. You skip the flow generation installation if you already have a v5 or v9 netflow source you could point to your LogStash instance. My testing was done with netflow version 9, but it appears the the LogStash netflow codec will also support 5. Softflowd required, byacc which you can get from here.
$ ./configure
$ make
$ sudo make install
Next, setup the netflow daemon that will create flow records from traffic on an interface that is designated. You can download the Softflowd source from here.
$ ./configure
$ make
$ sudo ./softflowd -i eth0 -n 127.0.0.1:12345 -v 9 -d
Before running ElasticSearch or LogStash, you will need Java. The latest 7.0 Java version should work just fine. You can confirm your Java version:
$ java -version
Before we run LogStash, grab the latest ElasticSearch version from the 0.90.x train. While ElasticSearch 1.x is out, I do not believe LogStash is yet compatible. If need be, you can edit the memory requirements in the following configuration file:
$ vim ./elasticsearch-0.90.12/bin/elasticsearch.in.sh
Next start the ElasticSearch instance:
$ sudo ./elasticsearch-0.90.12/bin/elasticsearch
Pull the latest LogStash JAR, before trying to run it, you will need a netflow configuration file. This configuration file says that we expect to receive network flow on UDP port 12345. Secondly, we output to STDOUT and the ElasticSearch entry, the former output is for testing.
input {
  udp {
    port => 12345
    codec => netflow
  }
}
output {
  stdout { }
  elasticsearch { host => "127.0.0.1" }
}
Next, we begin collecting netflow:
$ sudo java -jar ./Downloads/logstash-1.3.3-flatjar.jar agent -f logstash/netflow.conf -- &
After a minute or two, you should start seeing some entries via STDOUT in the terminal you started LogStash in. While you could start Kibana with the previous entry by adding the web toggle, I preferred separate instances for my evaluation:
$ sudo java -jar ./Downloads/logstash-1.3.3-flatjar.jar agent web -- &
Lastly, the fun part, you should be able to cruise over to either localhost or whatever IP address the systems as appending by port 9292 and starting tinkering:
http://127.0.0.1:9292
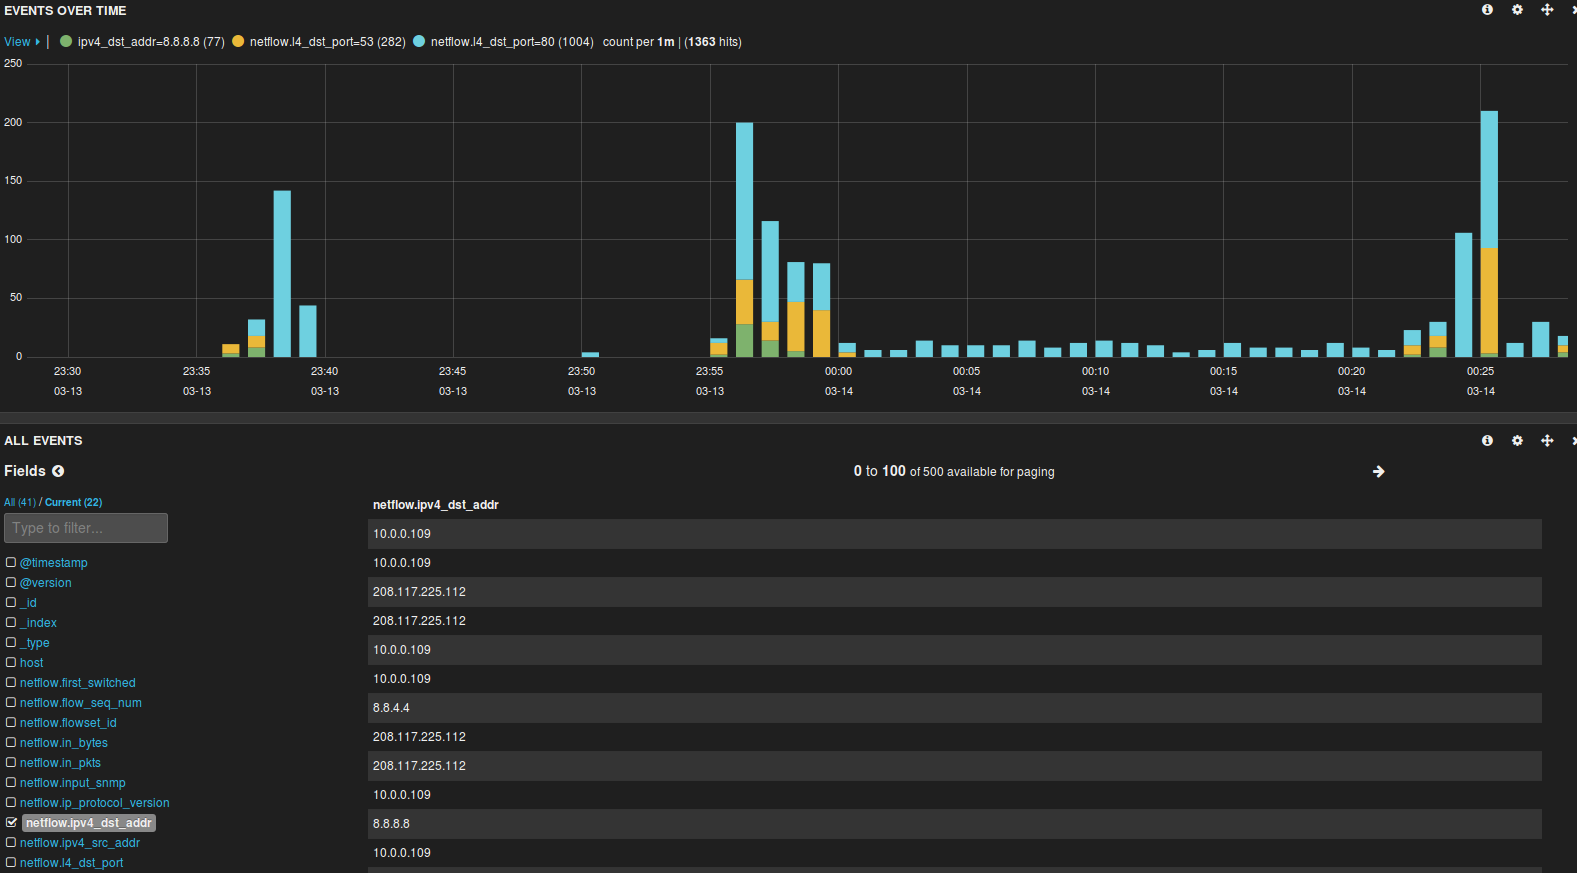
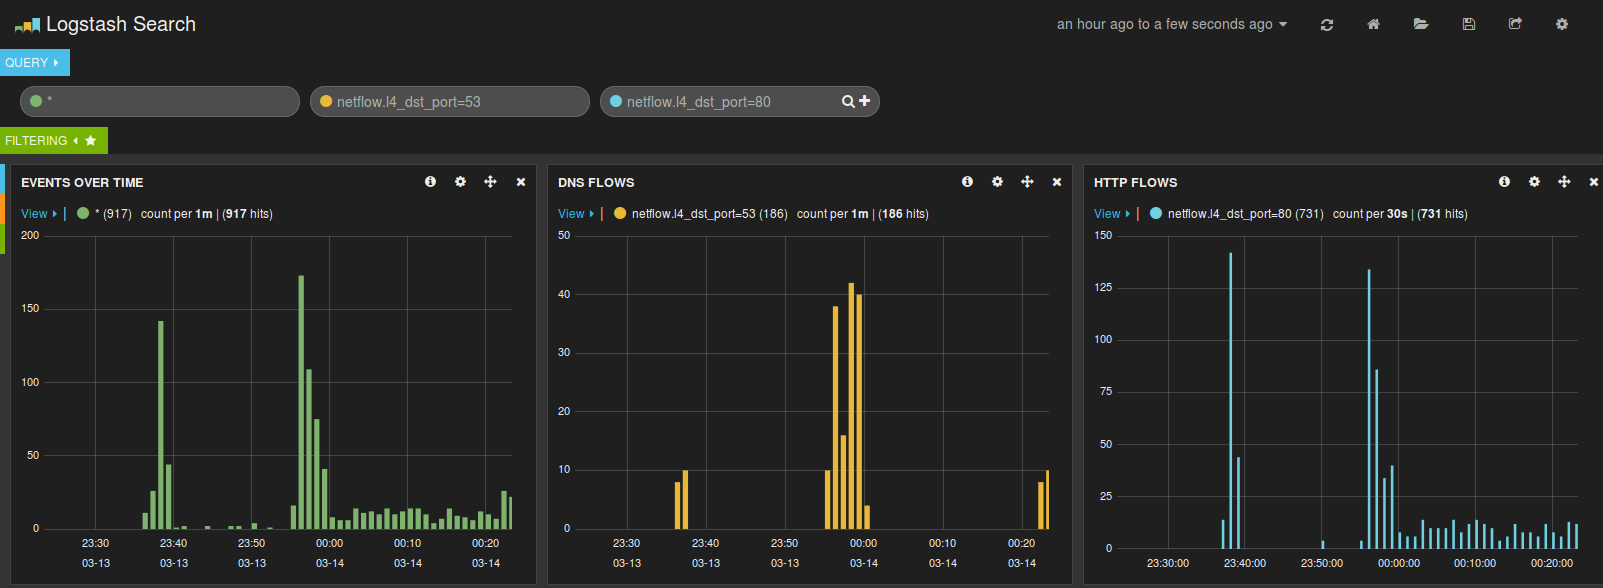
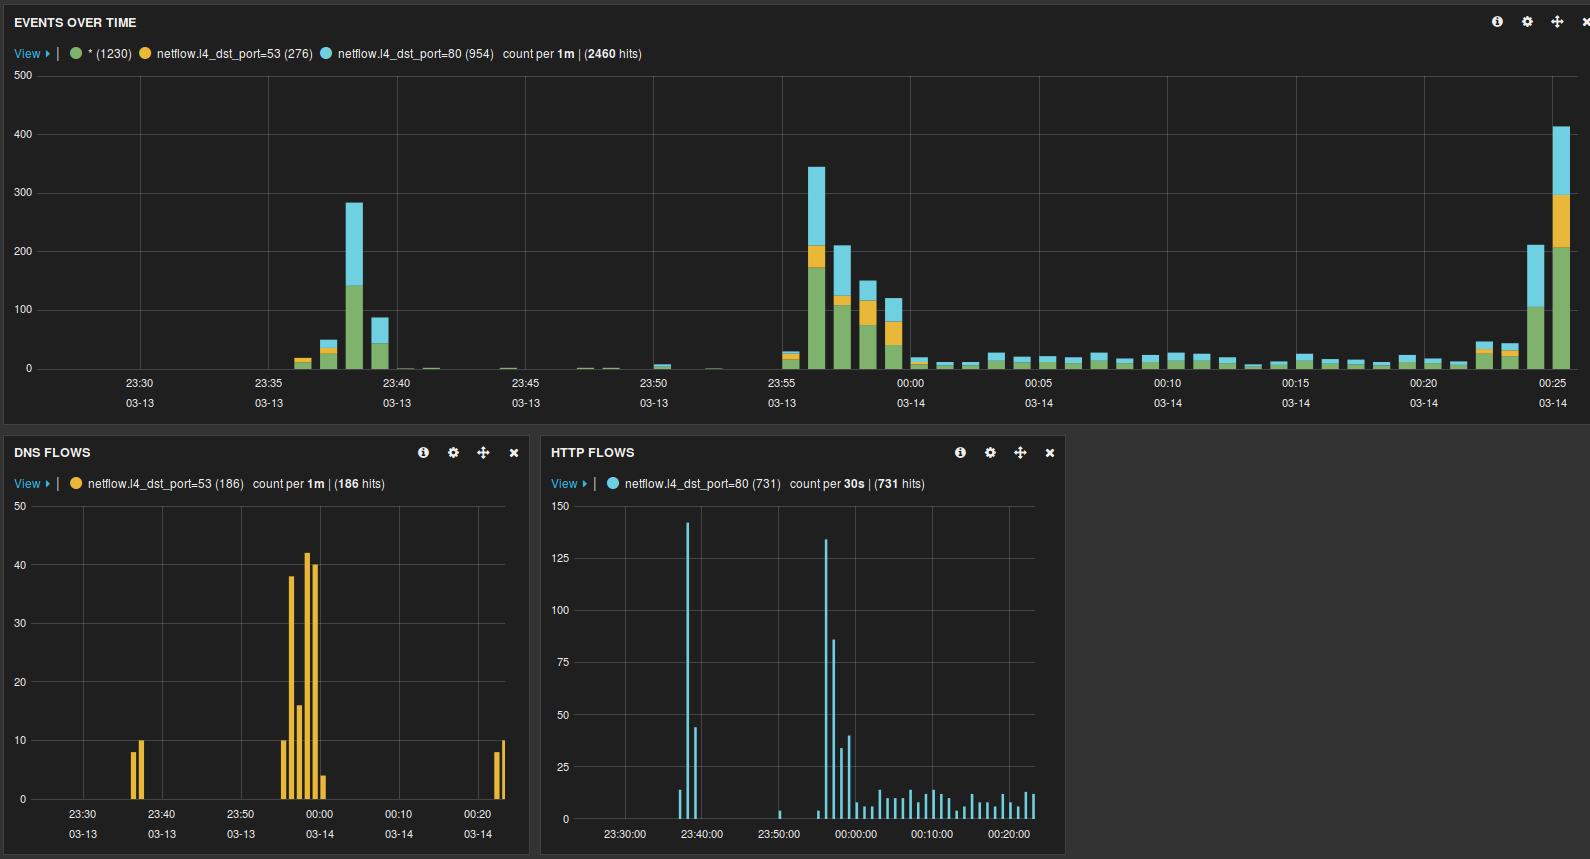
Here are three dashboards I quickly put together. Not only is Logstash a good way to quickly parse netflow, the dashboard shiny:
Leave a comment below if you have any questions.
Comments
comments powered by Disqus